

The coworking industry has never lacked opinions.
At different moments over the past decade, it has been described as a short-term trend, a speculative bubble, a saviour of office real estate, or a fragile model waiting to be disrupted. Headlines have swung between extremes, often faster than the businesses themselves could change.

It has been a privilege to be part of this industry since 2012 and to witness how the coworking movement grew into a truly global one, hosting millions of people working every day from tens of thousands of spaces around the world.
When we started Flexspace Observatory, a data-led initiative powered by Nexudus in 2021, our goal was to provide the industry with an open resource that helps put change into context and, ultimately, supports more informed decision-making.

Today, we have just relaunched Flexspace Observatory. It now aggregates 10 years of global coworking data, covering thousands of spaces across markets, sizes, and business models. That time depth matters, because structural change does not reveal itself in quarters. It reveals itself when you zoom out.
And when you do, a quieter, more interesting picture emerges.
From disruption to signal: identifying the inflection point
Every industry experiences moments that expose its assumptions. For coworking, the early 2020s marked such a moment. Not only because the COVID pandemic disrupted activity overnight, but because existing trends were suddenly accelerated, slowed down, or put under real pressure.
Looking at global resource demand over time, the initial disruption is clearly visible. What matters more, however, is what followed.
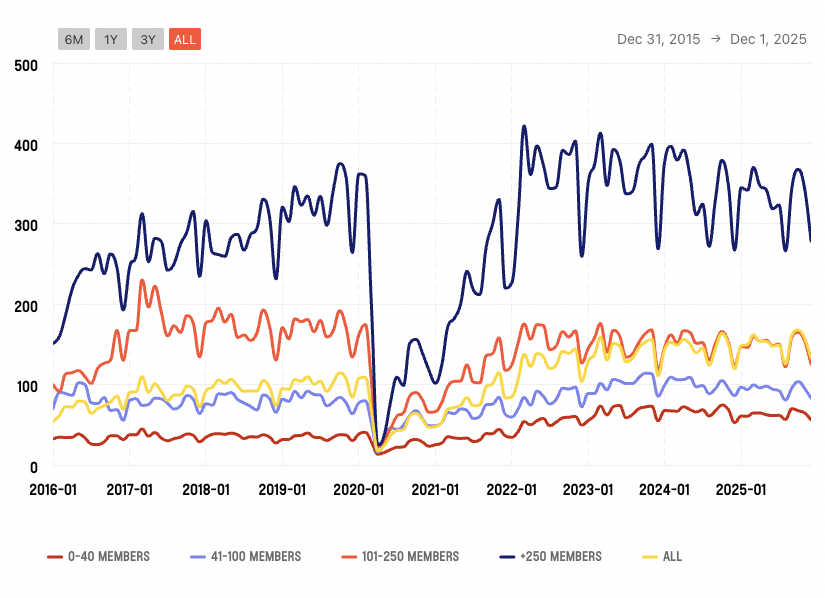 Number of bookings per location
(See: Global Resources Demand – December 2025)
Across markets, recovery was uneven but far from random. As demand stabilised, a clear rebalancing appeared in how members consumed space. We consistently observe less long-term commitment, more on-demand usage, and a greater sensitivity to optionality.
This shift is one of the most frequently misread signals in the data.
Flexibility didn’t increase churn. It changed the shape of demand
A long-standing assumption in coworking has been that greater flexibility inevitably leads to instability. Shorter commitments, the logic goes, must translate into weaker businesses.
The data suggests something more precise.
Flexible access products and hotdesking grew faster than fixed products over the past several years, particularly in multi-location portfolios. But this growth did not coincide with a collapse in utilization. Instead, it coincided with shorter planning horizons on the member side.
In other words, members didn’t stop using spaces. They stopped pre-committing to how long they would use them.

That distinction matters.
Operators who interpreted this as falling demand often responded defensively, tightening capacity or racing to the bottom on price. Those who recognised it as a shift in risk allocation adapted their product mix, pricing logic, and portfolio design instead.
Flexibility made commitment itself more valuable and more negotiable.
Occupancy today: less predictable, not structurally lower
Another persistent narrative we still hear is that occupancy never really recovered. At a market level, that claim does not hold up cleanly.

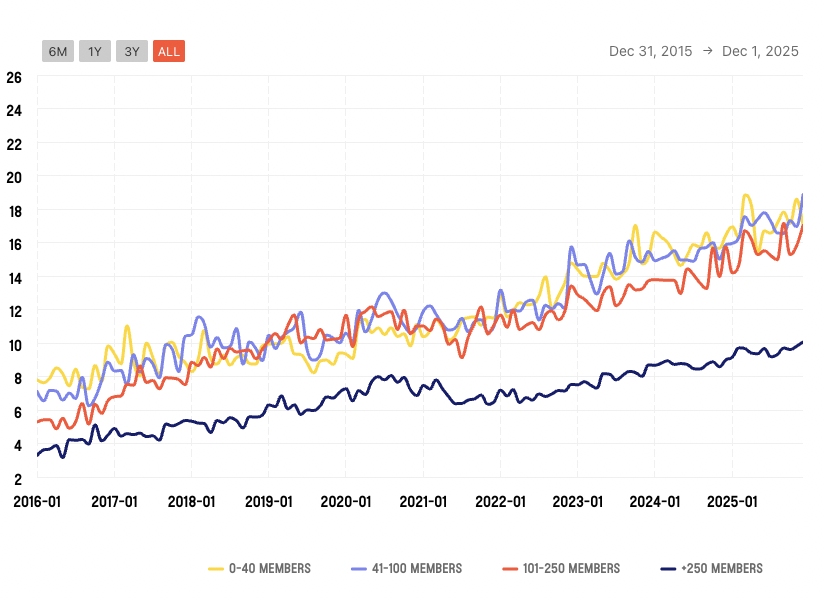 Member tenure per coworking size
(See: Market Analysis – Member Tenure – December 2025)
What changed most clearly was not average occupancy, but variance. We see sharper peaks, deeper troughs, and faster reversals.
Earlier in the decade, occupancy curves were relatively smooth. In more recent years, they have become noisier. The same annual performance can now hide far greater month-to-month volatility.
This shift created a perception gap.
Many operators continued to rely on static occupancy thresholds, benchmarks developed in a more stable era, while the underlying system had become more dynamic. The result was a widespread misinterpretation of performance, particularly in larger portfolios where volatility aggregates unevenly across locations.
Maturity became visible in the data
One of the most revealing long-term signals is the role of operator maturity. When we examine member tenure patterns over time, a consistent pattern emerges.
(See: Member Tenure Patterns – December 2025)
Operators with clearly defined products, disciplined pricing structures, and operational consistency across locations tended to stabilise member tenure faster and more predictably.
Less mature operators experimented more aggressively, sometimes creatively and sometimes reactively, but often at the cost of higher churn and reduced predictability.
This is not a story about small versus large operators, or independent versus corporate models. It is a story about business model clarity.
Periods of disruption do not reward flexibility alone. They reward operators who understand what kind of flexibility they are actually selling.
What this means heading into 2026
The temptation now is to treat the early 2020s as a closed chapter. The data suggests something more enduring.
What emerged over the past decade was not a temporary deviation, but a new operating context. Flexibility became a baseline expectation. Volatility became normal rather than exceptional. Operator maturity became measurable rather than anecdotal.
FlexSpace Observatory is not a benchmarking product designed to rank winners and losers. It exists to provide context and help operators, analysts, and journalists understand what the coworking and flex industry looks like today.
Explore the data yourself: FlexspaceObservatory.com
We will keep publishing what the data shows, even when it is less dramatic than the narratives built around it.