- When planning and designing a company workspace, data – such as head counts and square footage – is essential.
- But how do you measure things like culture, morals, productivity, and well-being?
- Stantec’s Brad Robichaux and Stephanie Wood explore how to utilize data, while also taking a holistic view, to create a space that fosters community and ‘buy in’ that is tied to company culture.
This article was written by Brad Robichaux and Stephanie Wood and was originally published on Work Design Magazine.
What is the significance of data when space planning? Head counts, seat counts, and standards are all typical ways to start generating square-footage requirements, but these are simply numbers and counts. They do not reflect the holistic view of the ‘heart’ of a company and its staff or how the work environment should be organized to optimize things like culture and wellbeing, while supporting productivity and creating a space where staff thrive. So how are things like culture, morals, productivity, and well-being measured in the first place? Is it even possible? If it is possible, how is that information leveraged to create a sense of community and ‘buy in’ that is tied to company culture? Can that be accomplished through space planning?
The answer is yes. A carefully planned process – unique to each client – is critical to align their elements (space and culture) by successfully engaging the client from start to finish.
Start with the client vision in mind
Initial engagement with the client begins with visioning, which aims to host a discussion that enables clients to prioritize what is most important to their company. Topics range from service delivery to sustainability to workplace culture. Questions are posed during the discussion that are intended to not only extract goals and expectations, but also to raise awareness from different angles, points of view and even introduce information pertinent to space needs, such as best practices and benchmarking. This provides the framework for understanding and prioritizing overall client needs, requirements, and wishes. We can then use the framework throughout the subsequent phases where more specific, detailed information is gathered from a strategic variety of sources.
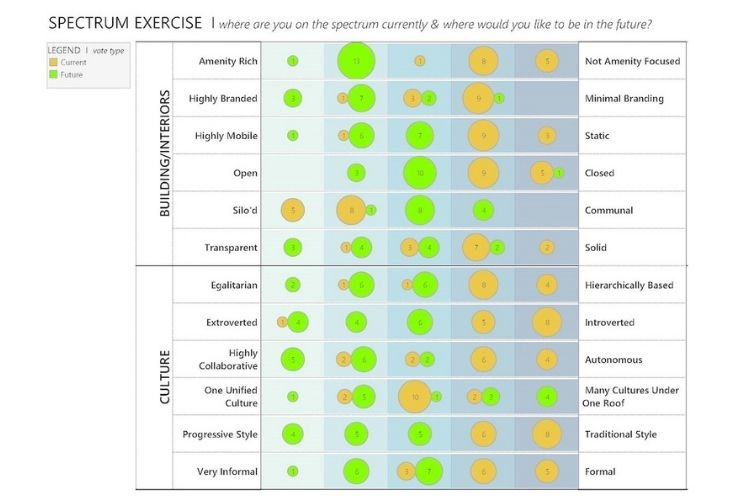
For the subject of culture and morale, it is important to establish an environment of psychological safety when approaching focused groups of employees. Creating a safe space for employees to express potential disengagement or cultural voids will yield more valuable data and feedback. Morale and culture are very difficult to measure without the necessary context of a company’s organization and structure. Since culture is typically what people do when no one is looking, it grows into unspoken social norms and will often affect employees more than formal written policies.
Design by the numbers
Sure, the end goal is usually to collect as much data as possible within a limited window of time, How the data is collected is just as, if not more important and will inform the entire conversation and the resulting dataset. This data will also form the development of an accurate representative baseline of required space needs. Collecting data from individuals of similar management levels will provide context to the data and can be paired with company hierarchy. Example: Do managers think everything is ok, while everyone else thinks the ship is sinking? Recognizing a potential disconnection of cultural perspectives can highlight the need for increased engagement, communication, or leadership shifts.
In the context of evaluating an organization’s workflow or productivity needs, most companies will focus heavily on the type of work a group performs. However, it is just as important to understand how the work is being performed. Approaching this topic requires a curious, open, and exploratory mindset. Using exercises that investigate “A Day in the Life” will allow employees to think about their work activities through a different lens.
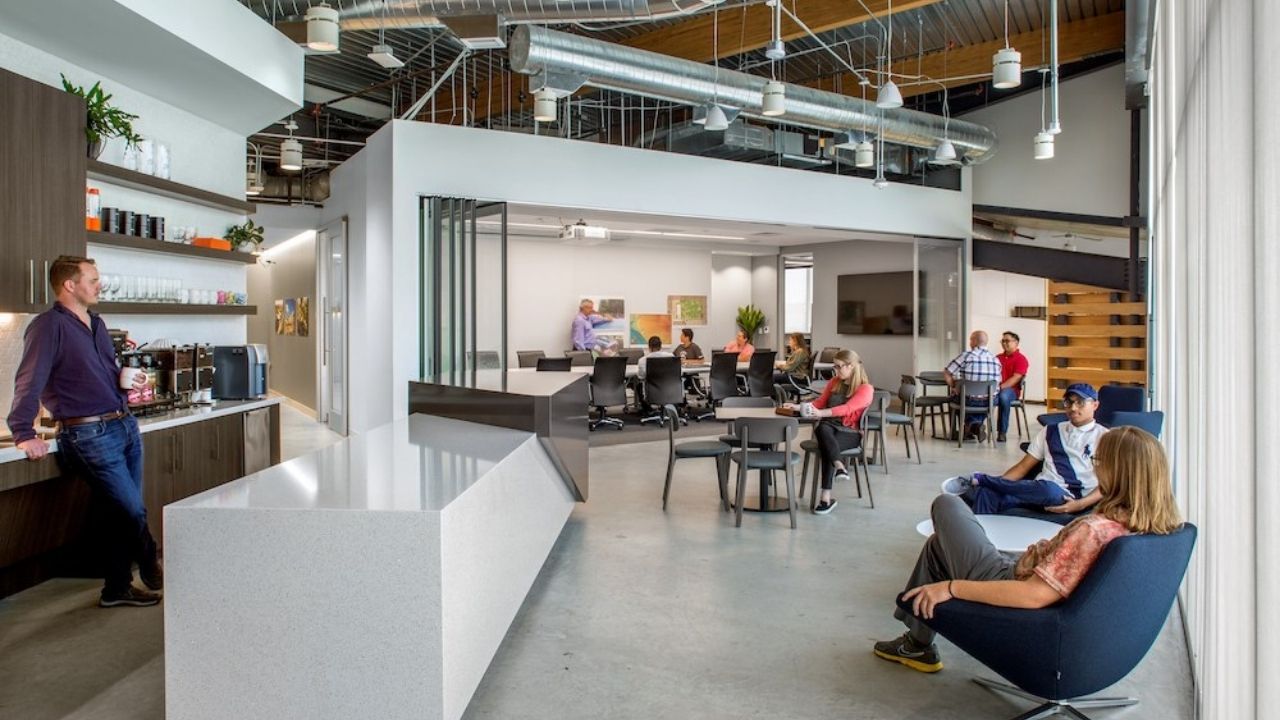
What postures do they prefer for different tasks? Upright and focused? Lounged and relaxed? Open and noisy (collaborative)? Dark and enclosed (head’s down)? Providing options for employees can empower them to be more productive by allowing them to choose the posture type or environment that suits the immediate task. Employees that have options express increased efficiency, engagement, and wellness.
Investigating how people work within the physical environment can sometimes dissolve stereotypes of different groups within the organization. Why do we assume all accountants are drawn to towering cubicles? Do lawyers always want to be enclosed in offices with their massive mahogany desks or would they prefer spaces that allow them to collaborate on cases with colleagues? Breaking through stereotypes and asking these questions in a safe space can reveal insightful data and we can then use for creative problem solving and planning.
Plan with all the facts
Asking the right questions produces the raw data necessary to begin space planning. Holistic analysis of the data collected requires constant oscillation between micro and macro lenses. How do staff members interact daily? How do departments or groups perform at their best? What type of ‘worker/persona’ can we assign that begins to speak to the type of work environment we’re planning for?
For example, a group might function best when they have ample choices of work points to use. This may range from working at home to a focus space provided within the office to a social café style meeting space. The characteristics associated with this persona type can then be assigned a set of parameters based on specific standards and requirements, which can then be represented through visual graphics and analysis. One of the parameters may include work point sharing ratios. Based on the understanding of this group’s preferences of work-point sharing and a desire to hotel, head count to work point ratios can be generated. Perhaps it is a 10:1 hoteling ratio for touchdown spaces, 35:1 hoteling ratio for focus spaces, and a 6:1 ratio for work point sharing at a workstation. Because this group would require fewer seats than their head count, further analysis is needed to cross check the data that relates to the number of in-person meetings and collaboration requirements. This helps determine what kind and how many support spaces are needed.
Another consideration is support space requirements for peak occupancy—the largest anticipated number of staff that would be in the office at a given time. This may be determined based on the need for collaboration or policy requiring staff to attend the office on a particular day. For example, there might be a meeting that requires everyone to attend in person on a weekly basis. This would indicate a peak occupancy data, which would then necessitate a re-examination of the support spaces provided to accommodate the additional influx of staff. Spaces like huddle rooms, focus rooms and collaborative space can provide enough seats for everyone to have a place to ‘plug and play’ while they are at the office.
Keep it custom
Each organization has a unique blend of persona types. Once these have been identified and analyzed, the next layer of evaluation investigates interactions between personal types. This not only helps to nurture productivity, but also to re-enforce company culture. Can some groups share spaces? Is it conducive to collaboration and/or workflow? By examining the data collectively, we can then begin to understand the bigger picture of how each individual group’s needs relate to each other and to the larger company vision to build a holistic program.
Even with diligent and comprehensive data collection and analysis, inevitably, there will be variables to contend with before determining a final program. Variables could be anything from future growth projections to alternative workflows. Whatever the variables are, they can alter the total square footage need significantly. Developing a baseline scenario program allows for comparison of alternative scenarios that include the variables. Alternative scenarios can be represented in several ways. A stack diagram not only gives an idea of how much square footage any group may require in relation to the amount of available square footage on a floor within a building but can also illustrate other data collected, such as: adjacencies, ideal support spaces, and proximity to social or focus spaces on that floor.
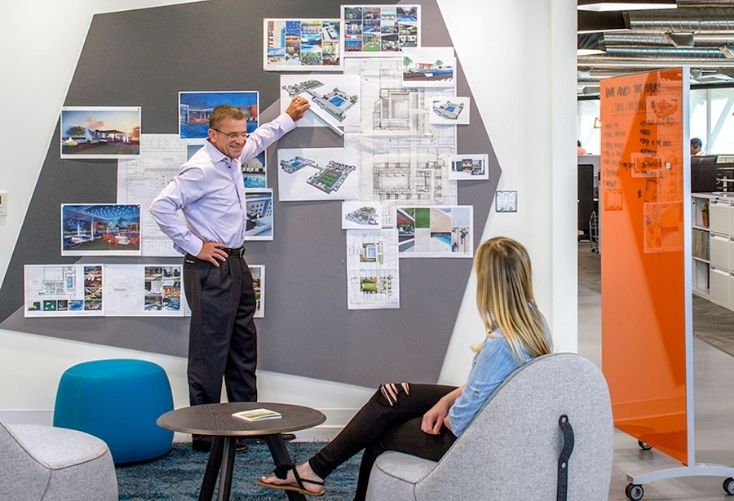
The visualizations produced are manifestations of the data gathered over the course of the project, both qualitative and quantitative. They enable the client to understand the complex network of data in an easy to digest manner. Workshops with the client utilize visualizations to highlight various possibilities and further help prioritize space needs. In the end, the data collection and analysis process build trust from the client – which, in turn, creates a successful workplace design.


 Dr. Gleb Tsipursky – The Office Whisperer
 Nirit Cohen – WorkFutures
 Angela Howard – Culture Expert
 Drew Jones – Design & Innovation
 Jonathan Price – CRE & Flex Expert
